

Introduction
Launched in December 2016, AWS X-Ray provides an end-to-end view of service mapping and traces for application flows to allow easier analysis and debugging of distributed applications running on AWS Cloud.
This service is designed for various types of microservices applications and works with a wide variety of AWS services, like Lambda, EC2, ECS, EBS, and EKS.
In this article, we’ll explore how X-Ray distributed tracing works, its architecture, initial setup, and some simple use cases. We’ll conclude by taking a quick tour of some of the available alternatives.
How AWS X-Ray works
X-Ray first collects data from each of the services, combines the gathered data into a single unit known as a trace. Then, using this data, it builds a service map that shows each request trace and displays the latency, HTTP status code, and other metadata information. All of this information can be crucial to developers and architects trying to debug performance issues in development and production alike.
For example, if we consider a simple microservice-based application consisting of AWS API Gateway, Lambda, and DynamoDB, we can watch how each transaction is performing, starting from API Gateway all the way through to DynamoDB.

source: AWS
AWS X-Ray and distributed tracing
Distributed tracing is a must-have in a microservice architecture. In a typical microservice design, each service will be distributed hosted and communicating with each other in a single request. It can become highly tedious to trace a request that spans across multiple AWS services. If we use only CloudWatch Logs to debug an issue, it takes significant time to go over each LogGroup & LogStream created to find the request in order to debug. That’s why we need a distributed tracing service like X-Ray which can generate an end-to-end view of each request and provide related information to debug issues.


AWS X-Ray architecture
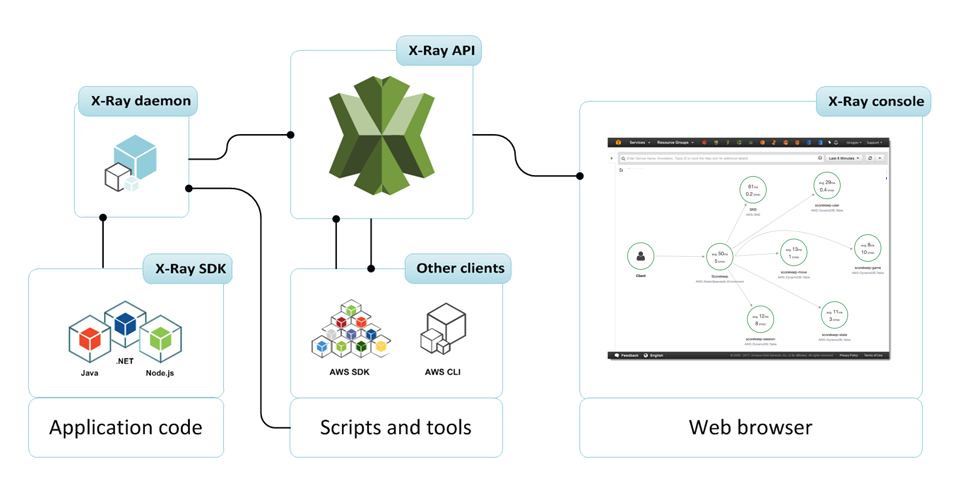
X-Ray daemon
The daemon is a software application that listens to UDP port 2000. It gathers the trace data from each segment and relays it to the X-Ray API. This is eventually used by the X-Ray console to group everything together to display service maps and traces. It works in conjunction with the X-Ray SDK to collect the data.
X-Ray API
AWS X-Ray provides many APIs for managing and retrieving traces and service maps.
It also helps to retrieve other telemetry data created by processing those traces. These
APIs can be accessed through AWS SDK and AWS CLI.
It also helps to retrieve other telemetry data created by processing those traces. These
APIs can be accessed through AWS SDK and AWS CLI.
X-Ray console
The console provides us a view of service maps and traces of application requests. The service map provides a visualization of the JSON service graph. The JSON consists of the trace data generated by applications.
X-Ray SDK
AWS supports many languages, including Java, Nodejs, and so on, with SDKs that provide classes and methods for generating and sending trace data to the X-Ray daemon.
Other Clients
These include the likes of AWS SDK and AWS CLI, which provide features to interact with X-Ray API and daemon.
AWS X-Ray Setup
There are various AWS services for which X-Ray can be setup. We will limit this article to only the Lambda function setup (we are serverless-first, after all). Let’s explore the various channels through which X-Ray can be set up for a Lambda function:
1. AWS Console - Once a Lambda function is developed and deployed to the Lambda service, X-Ray can be enabled through the AWS console.
 |
| AWS Console |
It requires an IAM role to be assigned, which has the necessary access to put messages in the X-Ray service.
2. AWS CLI - It can be used to interact with X-Ray APIs, and put and retrieve traces.
3. Serverless Framework - Serverless Framework is the most commonly used deployment framework used to build production-grade serverless applications. X-Ray tracing can be enabled by putting the following configuration in your serverless.yaml file.
Serverless.yaml -
---
tracing:
apiGateway: true
lambda: true
iamRoleStatements:
- Effect: Allow
Action:
- dynamodb:*
- logs:*
- xray:PutTraceSegments
- xray:PutTelemetryRecords
Resource: "*"
---
Building a simple use case
Ok. Let’s build a Lambda function and enable the X-Ray service for it and see how it helps to debug issues:
Step 1 - We will use the AWS Cloud9 service to create and deploy the Lambda function.

Step 2 - We have created a simple Lambda Function using Node.js, and deployed it to the Lambda service:

Step 3 - Now, let’s enable the X-Ray tracing through the AWS Console. It will also add a permission to the execution role of the Lambda function to send data to the X-Ray service:


Step 4 - Let's hit the Test button a couple of times on the top right side of the screen to generate some traces. Now, when we go to the X-Ray console we can see that there are two nodes, one for the Lambda invocation and another for Lambda execution.


Step 5 - We can click on the ‘View traces’ button on the bottom right side of the screen. From here we can view the details of how much time a particular request took for invocation/execution and the HTTP status code:


Step 6 - Now, let’s try to add some more code to our Lambda function. We will add code that tries to access the S3 service and call the S3 API method to return the list of buckets.


Step 7 - Again, let’s deploy this code and hit the ‘Test’ button a couple of times to generate a few traces. If you notice, now there will be one more node for the S3 segment, but outlined in yellow rather than in green. The reason for this is that it has some errors.

Step 8 - Let’s go to the trace to debug this error. We will observe a red alert icon for the S3 record. When we click on this it will show error details. As we didn’t assign any S3 access-related IAM policy to the role assigned to this function, it is not able to access the S3 buckets:


While this example may be simple, there are many complicated issues that can be debugged using X-Ray, especially performance-related issues.
We can also define annotation and metadata for requests by creating sub-segments using AWS SDKs for various supported languages. These attributes can be used to search particular traces using keywords.


Request Sampling
X-Ray request sampling is the most important unspoken feature. An x-Ray may be relatively cheap, but if we trace every request of our application, the cost will add up very quickly. So, we can use sampling to filter requests based on specified criteria. Using custom rules we can control the behavior of tracing sampling without modifying the code. For example, if we want to trace only the POST method call of the API, but not GET, PUT and DELETE, we can configure it.
Limitations of AWS X-Ray

Even though we had an error accessing the S3 service from our Lambda function, X-Ray shows “OK” for all the traces, as it’s getting a 200 response. This is a bit confusing for developers as we won’t know if there are errors until we go inside each trace.
Annotation and metadata for filtering traces can be added only for sub-segments. It cannot be done for root segments, so there is no UI feature to add these at the segment level. That means, we always need to go into our code and add sub-segment code using AWS SDKs around each functional code block we want to trace.

AWS X-Ray Pricing
Like many other AWS services, X-Ray doesn’t have any upfront fees. We pay for what we use - the number of resources recorded, retrieved and scanned.
Free tier:
The first 100,000 traces recorded each month are free.
The first 1,000,000 traces retrieved or scanned each month are free.
Charges beyond the free tier:
$5.00 per 1 million traces recorded.
$0.50 per 1 million traces retrieved.
$0.50 per 1 million traces scanned.
Alternatives to AWS X-Ray
There are generally two types of distributed tracing solutions available: open source and commercial tools. Let’s look at how these tools stack up as alternatives to X-Ray.
Open source tools - these are free to use. However, they need to be set up, monitored and managed by teams. Examples include Jaeger, OpenCensus and Zipkin.
Commercial tools - These are easy to set up and use, compared to the open-source tools. These are generally charged based on the number of invocations.
Jaeger
Jaeger is an open-source tracing system used for microservice applications. It is built on OpenTracing standards. It provides an all-in-one executable that can be used to install Jaeger for quick local testing. It is part of the CNCF project, so it is the preferred choice for the Kubernetes environment.
OpenCensus
OpenCensus is another Apache-licensed open-source system that originated from Google. It provides a set of libraries called Census that are used to automatically capture traces and metrics from services.
Zipkin
Zipkin was developed by Twitter and is now supported by a dedicated open source community. It was one of the first distributed tracing systems to gain popularity. Applications need to be instrumented via Http and Kafka to send the trace data to the Zipkin server.
Summary
Distributed tracing is the need of the hour as more and more applications are built using microservice patterns.
Monitoring and debugging has proven to be one of the more challenging aspects of serverless development, so investing in the right system for your needs is a must. AWS X-Ray is just one of several options available, so the choice is yours to make, based on your needs, budget and other constraints.


No comments: