

An in-depth overview of the major topics around debugging serverless
Serverless computing has changed the way enterprises design and build their production applications. It is no longer a hype but a mainstream application development technology. It has become a game-changer, enabling developers to build and ship faster. Now, a developer can concentrate on writing business logic rather than worrying about server provisioning, maintenance, idle capacity management, auto-scaling, and more.
AWS Lambda function is now a well-known service that builds serverless applications. Since its inception in 2014, it has been adopted very well by developers and architects.
AWS serverless application comprises several components. However, Function is the backbone of it. Other AWS services interact with each other through Function, completing the serverless workflow.
In this article, we are going to do a deep-dive and understand the testing and debugging of a typical Lambda serverless application. Before going further, let us first understand all the components involved in building a serverless application.

1. Event Source: - Lambda Function doesn’t have a REST API endpoint. Hence, it cannot be called directly from outside clients. It needs event triggering to get invoked. An event can be:
Data record change of a DynamoDB table
Request to a REST endpoint through API Gateway
Change in the state of resource e.g. file uploaded to the S3 Bucket
It can also be triggered through CloudWatch Events. As Lambda has been evolving, it’s constantly adding many other types of events.
2. Function: - All the functional logic goes here. It does support many languages, including but not limited to Java, Go, Node, Python. The event source triggers it and then connects to all other AWS Services to create a serverless pattern.
3.Services: - It can be either an AWS service or an external service. These services would be required either to persist or retrieve the data from other systems. Some of the services like SQS, SNS complements serverless flow with event-driven architecture.
So, we need to keep these components in mind while understanding the debugging of an AWS serverless application.
Debugging monolithic apps vs serverless
With all of the talk these days about microservices and serverless applications, monolithic applications have become the scourge of cloud systems design. However, it is known that there are certain aspects of application design where monolith still does better than microservices and serverless. And, debugging is one of them. Microservice and serverless didn’t come to address any of the existing debugging challenges of a monolith application. In contrast, it has brought new challenges though.
Different Aspects of Debugging a Monolith
1. Debugging a monolith application conjures specific images in the developer’s mind. The most common image would be the local environment using the favorite IDE ( Eclipse, VSC, IntelliJ, etc..). It is as simple as creating a breakpoint at the line of code that needs to be inspected and run the application in debug mode.

2. In a monolith, most of the issues are debugged in local as it uses to have only a few failures points UI/Backend or the Database behavior and in most cases, these can be set up in the local environment.
3. In a monolith, eclipse/IntelliJ is used to do remote debugging as well. It could be done from Eclipse, VSC, or STS IDE. It would certainly need privileged access to connect to the remote servers. It is being used in exceptional cases where simulating the same scenario was not at all possible in local.
4. Debugging a monolith application is simple and easy since all tasks run on a single process, it makes things much easier to test.
5. Though debugging a monolith is easier but it takes a lot of effort. A large application may take minutes instead of seconds to startup which slows down debugging effort. Also, reaching to a debugging breakpoint takes time if the monolith app flow is huge.
This was all about monolith debugging. Serverless has changed the way we do design and build the applications and that changes the debugging as well.
Different Aspects of Debugging a Serverless
1. With serverless applications, logging has become the most common way of debugging issues. Disk space has become cheaper and logs can be rolled after 30 days or so. It has become important to log everything that the service does and that helps developers understand the real behavior.
2. Serverless flow generally has more components involved, hence, failure points have increased. All these components may not be able to set up in the local environment.
3. Serverless applications by nature don’t give an option for remote debugging.
4. Serverless needs hopping across process, machine, and networking boundaries and that introduce many hundreds of new variables and opportunities for things to go wrong – many of which are out of the developer’s control but he has to debug when things go wrong.
5. Serverless brings loose dependency between components and as such it is harder to determine when compatibility or interface contracts are broken. It won’t know something has gone wrong until well into the runtime.
So, we can see that there are many differences in the way debugging works in monolith and serverless. Let’s talk a little more about the challenges serverless brings in debugging applications.
The Challenges of Debugging a Serverless
A serverless application in AWS has event sources like API Gateway, DynamoDB, SQS, Kinesis invoking a Lambda Function. Then, the function makes calls to DBs, SNS/SQS, the workload on ECS/EKS, or even services running outside AWS.
So, it is comprised of so many components and any issue may require to debug these so many components. Here are a few common challenges:
1. Distributed Components - serverless application components are highly distributed. It can be within AWS or outside. Simulating these local may not be always possible and doing debugging on a live environment is neither cheap nor easy.
2. Lack of remote debugging - serverless application by nature doesn’t give access to server and OS level so remote debugging is not an option. For rare cases, where the developer is not able to understand why the issue is happening and cannot do live debugging makes him handicapped.
3. Ephemeral - servers are ephemeral by design in serverless computing and that gives very limited opportunity to the developer to debug the issue.
4. High Cost - as most of the debugging are done in a live environment, it adds to the monthly bill. An application running on a live environment and being debugged for bugs/defects really hit the ROI to the business.
5. Lack of frameworks for local setup - there are very few frameworks available to do setup Lambda in locally and those also come with limitations.
Debugging Serverless Offline
Running and Debugging an application in local is a critical part of software development. Understanding that, AWS and even open source community came up with several tools that enable Lambda Function and serverless workflow to run and debug in local.
AWS Serverless Application Model (SAM)
It is an open-source framework majorly contributed by AWS that we can use to build serverless applications on AWS. SAM has two major components:
SAM template specification - We use this specification to define serverless application. We can describe the functions, APIs, permissions, configurations, and events in the specification.
SAM templates are an extension of AWS CloudFormation templates, with some additional components that make them easier to work with. Below is the YAML template for SAM specification:

SAM command-line interface (SAM CLI) - We use this tool to build serverless applications defined by AWS SAM templates. The CLI provides commands that enable us to verify that AWS SAM template files are written according to the specification, invoke Lambda functions locally, step-through debugging Lambda functions, package and deploy serverless applications to the AWS Cloud.
The process to Set Up the Debugger Run the below commands to start and debug Lambda in local:
sam init – It generates a preconfigured AWS SAM template and example application code in the language that we choose.
sam local invoke and sam local start-API – We use this command to test your application code locally. By adding a parameter -d we can enable a debug port as well.
e.g. sam local invoke -d 9999 -e event.json HelloWorldFunction
Once the function is up and running, the debugger is listening to localhost:9999. The event.json file has the event details configuration that is used to trigger the Lambda Function. Now, VSC or any other IDE can be used to debug the code. Let us take a walkthrough with VSC here.
When we hit the F5 button, VSC opens up the launch configuration. This configuration needs to be updated so that it enables the debugger UI to debug at a breakpoint. Below is a sample for the .vscode/launch.json configuration:

Once we run the debugger UI with the above launch.json, VSCode will attach itself with SAM CLI process and we should be seeing the breakpoint code is highlighted. We can also use the inspect option to see the detailed values of an object being debugged.

Alternatively, we can install AWS Toolkit in VSCode. This tool enables the links for running the function in locally. It also enables the debug option. To supply the event information, the Configure indicator from the CodeLens line is used. See the below example:

Serverless Framework -
It is also an open-source framework to provide a powerful, unified experience to develop, deploy, test, secure, and monitor your serverless applications. The benefit of this framework from AWS SAM is that it is not tightly coupled with AWS and can be used for other cloud functions like Azure Function.
The serverless framework comes with an open-source CLI which provides the support with commands to create and build serverless application using template yml file.
The process to Set Up the Debugger
Install the Serverless CLI using below command:
npm install -g serverless
Create a new Serverless Service/Project:
serverless create --template aws-nodejs --path my-service
It will generate the scaffold for a nodejs function code having a handler.js file along with a serverless.yml file.
handler.js file has the handler method which will be invoked through events. Business logic will reside in this file.
serverless.yml file has a configuration for all the Functions, Events, and resources required for a serverless application flow.
Now, as our application is ready to run, we need to install a plugin called Serverless Offline. This plugin emulates AWS Lambda and API Gateway on your local machine to speed up your development cycles.
Add serverless-offline in your project using below command:
npm install serverless-offline --save-dev
Then, inside your project’s serverless.yml file add plugin entry. If there is no existing plugin in the yml file, then add a new entry:
plugins:
- serverless-offline
To test if the plugin got installed successfully run this command:
serverless offline
It should print all the options for the plugin to run:

Now, run a nodejs application in debug mode.
Update the script section of the package.json file residing in the root folder:
"scripts": {
"start": "./node_modules/.bin/serverless offline -s dev",
"debug": "export SLS_DEBUG=* && node --debug ./node_modules/.bin/serverless offline -s dev",
"test": "mocha"
}
Note: This script is for the Linux environment. For Windows, we need to replace the “debug” parameter with:
"debug": "SET SLS_DEBUG=* && node --debug %USERPROFILE%\\AppData\\Roaming\\npm\\node_modules\\serverless\\bin\\serverless offline -s dev"
In the above code, we need to pay attention to the only debug section. The SLS_DEBUG environment variable is set to let the serverless framework know that this application needs to be running in debug mode. And once node executes node --debug command, it will use the serverless offline plugin to run the function in locally. We can also define the port in serverless.yml file which we want to map with this nodejs code.
Now, we can tell VSCode to run this code and attach a debugger to it by pressing F5. It will prompt you to set up a launch configuration. We need to use :
.vscode/launch.json needs to have below configuration:
Now we simply hit F5 or click debug > chose Debug and click play, our lambda functions will run locally with a debugger attached. This is what it would look like:
How to Debug Serverless
So far, we have seen how to debug a serverless application locally before we deploy the application in the AWS environment. However, once the application runs in a live environment, new issues may be discovered as it will now connect to real AWS services. It will talk to some of the services which we would not even test locally. Now, we will see the steps on how to debug application while running on AWS live environment.
Debugging with API Testing Tools -
To debug a serverless application on AWS, we may have to start with API Gateway testing. There are various clients available that can be used to test an end-point. The most common tools are Postman and SoapUI. Curl can also be used for simple testing.
Postman provides options for setting the request type, headers, SSL certificates, body, and tests. This approach works great for functions tied to API endpoints as event triggers, such as API Gateway. But not all Lambda functions are used this way. If a function is triggered asynchronously by other services, such as SQS, Kinesis, or even CloudWatch, we need to have other tools to debug.

Debugging with AWS Console -
AWS Console provides a testing option for the Lambda function directly without the involvement of the event source. It is very useful while deploying the lambda first time on AWS and check real-time issues.

It requires Test events to be created and run those events directly on the function while you are writing and building your application. These test events can emulate what is expected from any AWS services like SQS, Kinesis, SNS or so. Below is an example used to create a thumbnail from an image whenever it gets uploaded in the S3 bucket:

When we hit the Test button, output will be generated as below:
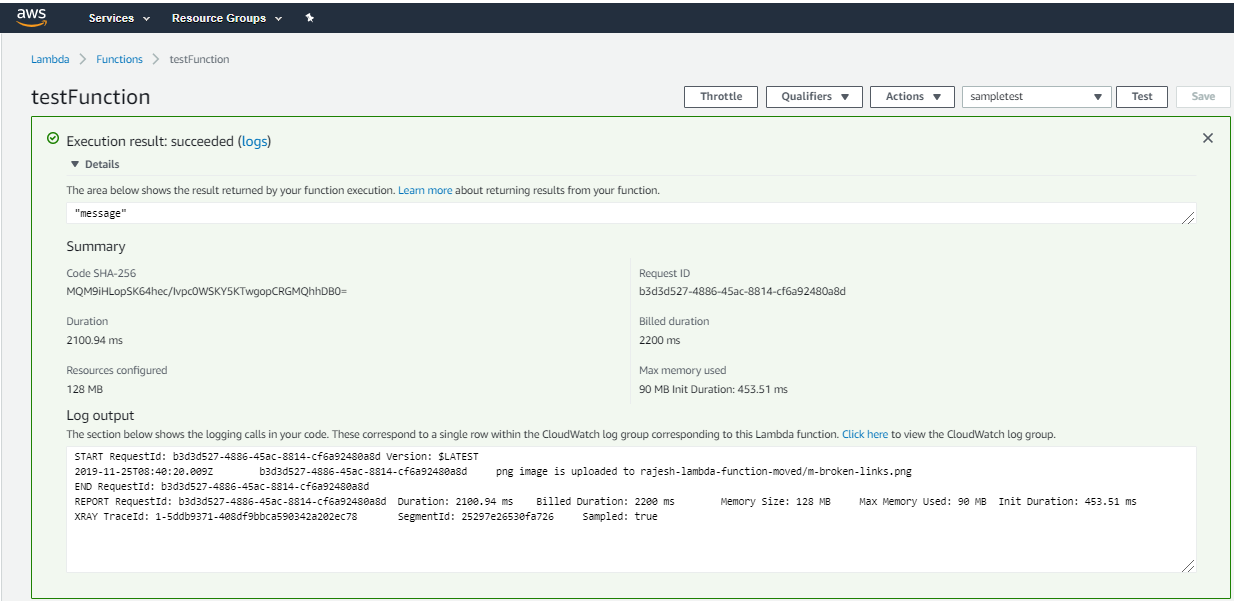
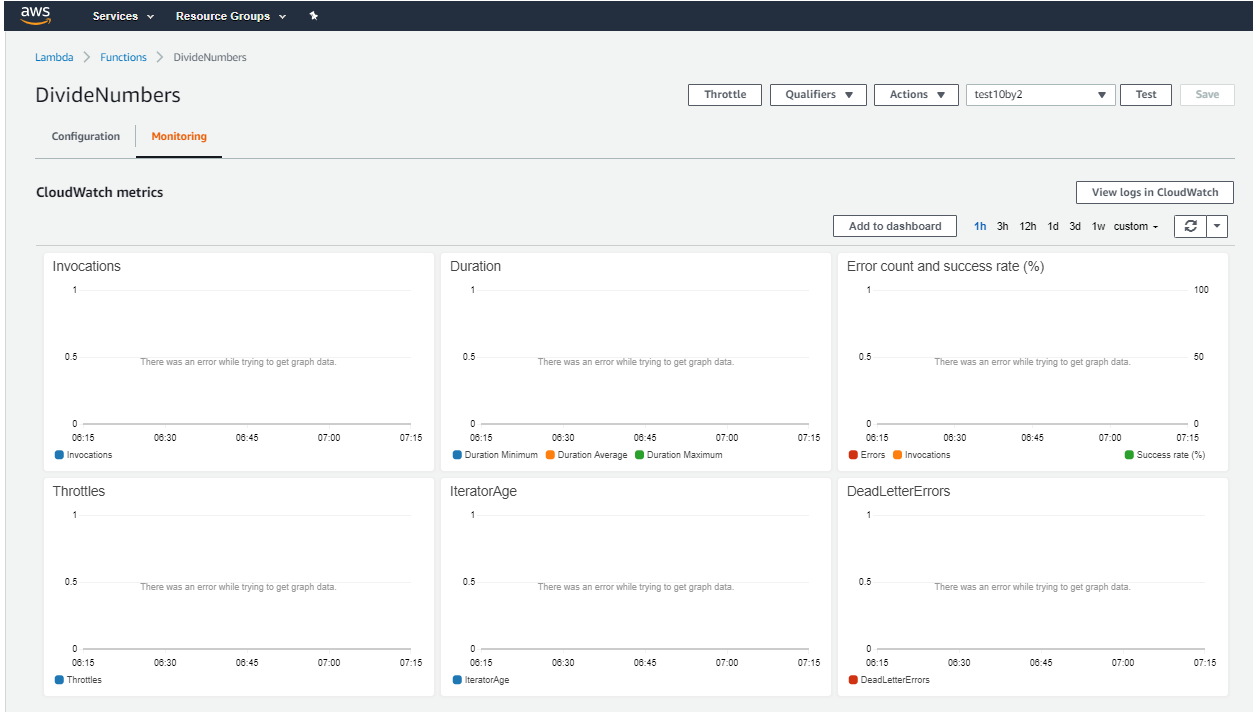
We can further check metrics using the “Monitoring” tab. It has out of the box metrics to check error rate, throttling, and others to help to debug the issues. Detail logs can also be viewed using the “View logs in CloudWatch” button.
Debug using AWS CloudWatch Logs -
CloudWatch Logs is the main source of information on how an AWS application is behaving. The same applies to the Lambda function. Lambda Function by default sends the log data to CloudWatch. CloudWatch creates a LogGroup for each Lambda function. Inside a LogGroup, there will be multiple Log Streams collating the logs that get generated from a particular Lambda instance (Lambda concurrency allows multiple instances created for a Lambda function).

Log Streams will have log events, clicking on each event will provide detailed information for a particular Lambda function invocation.
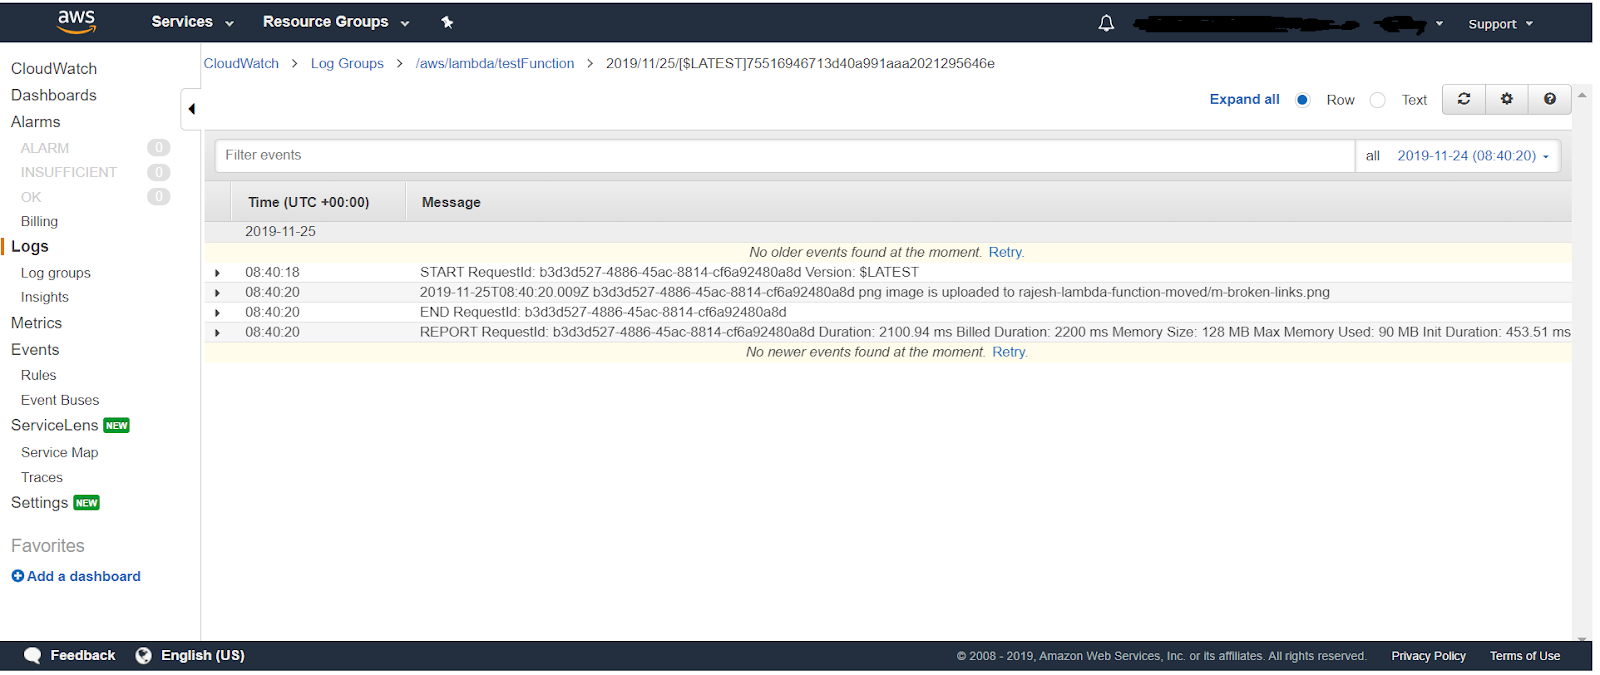
So, whenever a Lambda function has an issue, we know the steps on how to dig through and see the logs that are happening for that particular invocation. Logs appear in CloudWatch Logs are almost real-time so put logs as much as you need to debug an issue.
However, there are few caveats using CloudWatch logs:
- AWS does charge based on the size of the log data being stored in it. So, it is recommended to remove unnecessary log statements once the bug is fixed. It may also increase the size of your Lambda function as well which may cause a delay in loading and starting a function (warm start time).
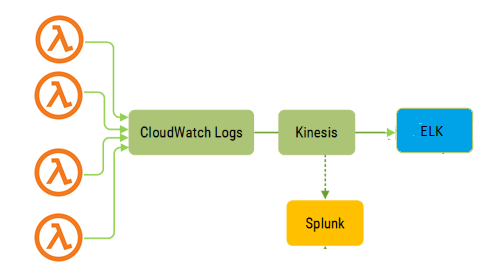
- Some of the enterprises which work with multiple clouds and/or on-premise platforms would be using Splunk or ELK for log aggregation and CloudWatch being very tightly coupled with AWS services only, would not be preferred by those organizations. In that case, CloudWatch Logs are streamed to these commercial tools through streaming services like Kinesis. These tools are also good at providing a visualization layer by creating several dashboards as per need.
- CloudWatch Logs becomes costly over time as AWS charge more for higher storage requirement. ELK being open-source is preferred by many to save the cost.
Below is a typical flow used to store and view the logs by these enterprises:
Debugging using X-Ray -
Despite having rich features in CloudWatch Logs, it is limited to providing information only for one component and in this case, it would be a Lambda Function. But, for a typical serverless flow, a function would be calling other AWS services like dynamodb, S3, or other services. What if we need to get more details around these integrations - how they are performing, what failures are causing performance issues.
For these, AWS introduced X-Ray which helps developers analyze and debug distributed applications. X-Ray provides an end-to-end view of requests as they travel through the application, and shows a map of the application’s underlying components. An X-Ray can be used to analyze both applications in development and in production, from simple three-tier applications to complex microservices applications consisting of thousands of services.

So, if we need to debug an application on the AWS environment, we may end up using multiple tools to get all the information. And, that’s why there are many commercial tools evolving and providing a seamless experience to monitor, trace, and debug the distributed applications with end to end flow visualization.


No comments: