AWS Lambda Layers

AWS Lambda framework is one of the most used services consumed by AWS customers. It is used to build event-driven architecture and serverless architecture applications. It supports various different languages like Java, Python, NodeJS, and many more to build Lambda Function. However, choosing the right language and managing the dependency is very critical as it may affect the size of the package and eventually the load time of the Function while starting instances. AWS Lambda layers is one of the best ways to reduce the size of the deployment packages. These Lambda layers can be for custom runtimes, libraries, or other dependencies.


Diagram placeholder


In this article, we would be going through deep into AWS Lambda framework packaging, Lambda layers working, and best practices around the Lambda layers.


AWS Lambda Framework Packaging

AWS Lambda works with many languages like Java, Python, NodeJS, and so on. A Lambda Function consists of the compiled code, script, and the dependencies it needs to run the code. To deploy this code to the AWS cloud, you need to ZIP the code and it's called a deployment package. 

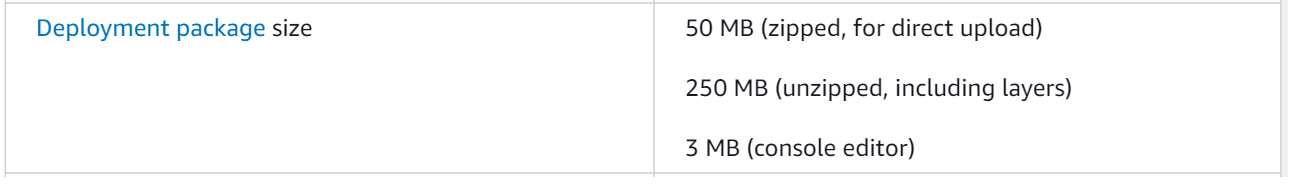
You can upload the package directly to the Lambda framework if the deployment package’s size is less than 50 MB, you must first use Amazon S3 to upload the package and then deploy it to the Lambda service. 

Now, the problem with deployment packages is that over a period, it will keep adding more and more dependencies as part of code that causes maintenance overhead. For a small change in a dependency’s code, Function’s code has to be touched, re-packaged, and tested. 

Another point is that the more the code you write, the more shared code will be developed that may be used across several Functions. To share it, the AWS Lambda Layers feature has been launched.


How AWS Lambda Layers Work 

Lambda Layers provides a mechanism to externally package dependencies that can be shared across multiple Lambda functions. This allows Function to reuse the code already written. Lambda layers reduce lines of code and size of application artifacts.


AWS Lambda Layers can be managed through AWS CLI and APIs. However, AWS has added the support of Layers in AWS SAM framework and AWS SAM CLI that is being used for packaging the Lambda Function code.

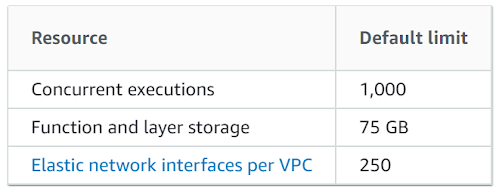
A Lambda Function can use up to 5 layers max. The max size of the total unzipped size of the function and all layers can't exceed 250 MB. You need to keep a watch on AWS Limits that is continuously changing to accommodate all new requirements.


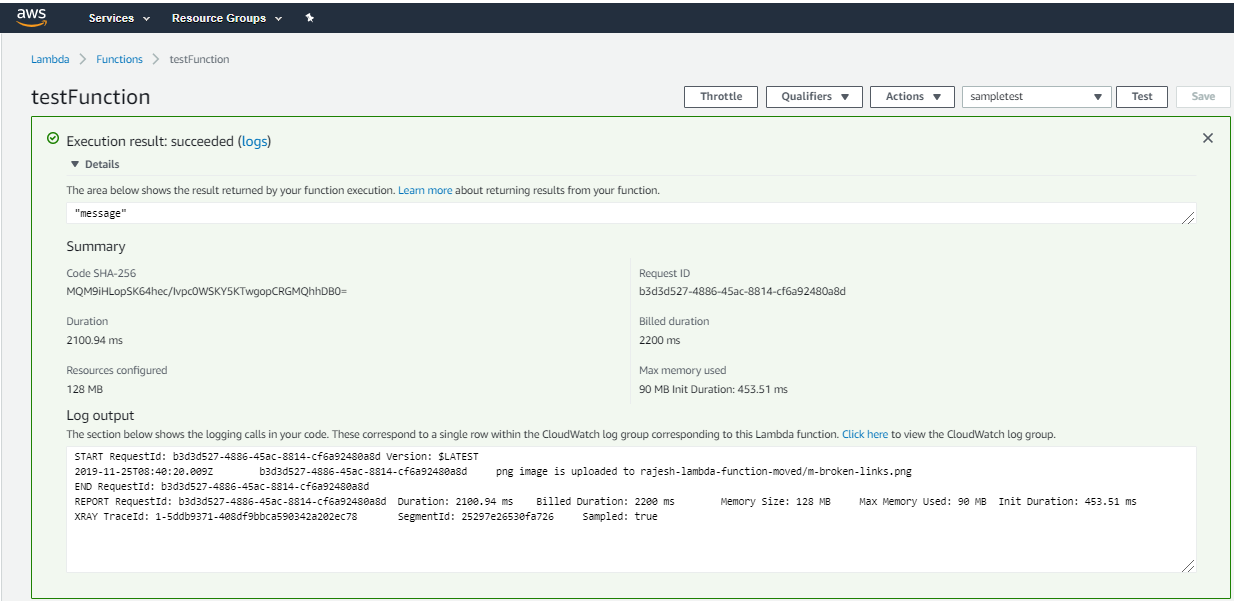
When a Lambda Function ( with a Lambda layer) is invoked, AWS downloads the specified layers and extracts them to the /opt directory on the execution environment of the Function instance. Each runtime then looks for a language-specific (NodeJS, Java, Python, etc..) folder under the /opt directory.


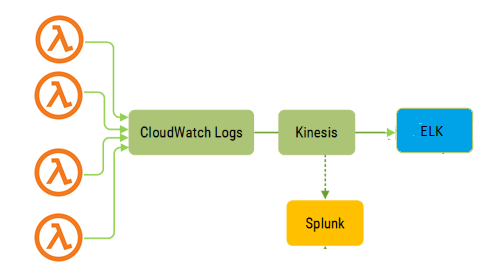
You can create and upload your own Lambda layers and publish it for sharing with others. You can implement an AWS managed layer such as SciPi, or you can grab a third-party layer from an APN Partner or other reliable sources. Below is a typical workflow for a Lambda layer:


Diagram placeholder


Including Library Dependencies in a Lambda Layer

Each Function will have one or more runtime dependencies that can be moved out of the Function code by placing them in a Lambda layer. To include libraries in a layer, place them in one of the folders supported by your runtime, or modify that path variable for your language.

For example: Node.js – nodejs/node_modules, nodejs/node8/node_modules (NODE_PATH)


Lambda runtimes ensure to include /opt directory in paths so that your function code has access to libs that are included in Lambda layers.


AWS Lambda Permission for Layers


AWS provides Identity and Access Management (IAM) to manage access to Functions and Layers. Layer usage permissions are managed on the resource. To configure a function with a layer, you need AWS Lambda permission to call GetLayerVersion on the layer version. You can get this permission by configuring your user policy or from the Function's resource-based policy. A Lambda layer can be added to another account as well by providing permission on your user policy. Also, the owner of the other account must grant your account permission with a resource-based policy.

Below is a command add-layer-version-permission that is used to add the layer usage permission:


aws lambda add-layer-version-permission --layer-name log-sdk-nodejs --statement-id xaccount 

--action lambda:GetLayerVersion  --principal 110927634125 --version-number 1 --output text

Permission is provided at the layer version level so you have to repeat this step for each time you add a new version for the layer.

How Lambda Layers Work in AWS SAM CLI

AWS SAM and its CLI are used to replicate the Lambda service environment in local and enable testing before moving the code to the AWS cloud. To enable the Lambda layers to support, it downloads all the configured layers and caches them in the local environment. You can use –layer-cache-basedir flag to specify the target directory to store the local cache of the layer. 


Downloading of layers happens when the first time you run either sam local invoke or sam local start-lambda or sam local start-api commands. To refresh the layer cache, you can use the –force-image-build flag.


The AWS::Serverless::LayerVersion resource type is used in the SAM template file to create a layer version that you can reference from your function configuration.


Below is an example of a SAM template for a NodeJS application that is using plain-nodejs-lib library as a layer.


AWSTemplateFormatVersion: '2010-09-09'

Transform: 'AWS::Serverless-2016-10-31'

Description: An AWS Lambda application for XRay demo.

Resources:

  function:

    Type: AWS::Serverless::Function

    Properties:

      Handler: index.handler

      Runtime: nodejs12.x

      CodeUri: function/.

      Description: Call the AWS Lambda API for XRay demo

      Timeout: 5

      # Function's execution role

      Policies:

        - AWSLambdaBasicExecutionRole

        - AWSLambdaReadOnlyAccess

        - AWSXrayWriteOnlyAccess

      Tracing: Active

      Layers:

        - !Ref libs

  libs:

    Type: AWS::Serverless::LayerVersion

    Properties:

      LayerName: plain-nodejs-lib

      Description: Dependencies for the plain nodejs app.

      ContentUri: lib/.

      CompatibleRuntimes:

        - nodejs12.x


Things to Remember for Lambda Layers

Though Lambda layers play a great role to distribute your code and share with others, there are few things to keep in mind:

  • For static languages such as Java, the compiler needs to have all the dependencies at compile time to build the JAR. That won’t be an easy integration.

  • You need to be careful while using the Lambda layer version shared by third parties as first they might have malware, vulnerabilities; second, you won’t have control on their SDLC so if they plan to remove the version that you are using in production and you have a need to upgrade your code, you won’t get the same layer version in your environment and will cause a failure.

  • Lambda layers are good when you need to share the same code with multiple Functions in your domain as you would have good control over the versions.

  • If you have a dependency that is very large in size, you can use layers to reduce the deployment package size and also the time of deployment.

  • If you are building a custom runtime for Lambda Function, layers is the best way to share it.


Summary

In this article, we looked into the role of AWS Lambda layers in building the Lambda Function code. We also talked about its features, how to enable it, secure it, and apply it using SAM CLI. There are few things we need to keep in mind that this feature has to be used only in special circumstances that we discussed in this article else it may bring overhead in the maintenance of the Function code.


Rajesh Bhojwani October 16, 2020
Read more ...

 AWS Lambda Limits

Serverless application architecture is the cornerstone of cloud IT applications. AWS Lambda has made it possible for developers to concentrate on business logic and set aside the worry of managing server provisioning, OS patching, upgrades and other infrastructure maintenance work.

However, designing serverless applications around AWS Lambda needs special care especially finding workarounds for AWS Lambda limitations. AWS Lambda limits the amount of compute and storage resources that you can use to run and store functions. AWS has deliberately put several Lambda limits that are either soft or hard to ensure that the service is not misused in case of getting into the hands of hackers. It also provides guardrails so that you follow the best practices to design the Lambda Function.


In this article, we will take a closer look into all types of Lambda limits defined by AWS and understand how they can affect in a certain use case. Also, we will see what are the workaround and solutions available to overcome these limits for valid use cases.


AWS Lambda limitations are mostly divided into two parts - Soft limits and Hard limits


Soft limits

Soft limits are defined with default values. Lambda soft limits are per-region and can be increased by putting requests to AWS support team.

Concurrent Executions Limit

In Lambda, scaling is achieved using the concurrent execution of Lambda instances. If a Lambda execution environment cannot fulfil all the requests for a given time, it spins off another instance to handle the remaining requests. However, spinning off the new instances infinitely may cause high cost and can be misused so a default AWS Lambda limit concurrency of 1000 has been put for it.


This limit is configured at account level and shared with all the Functions in the account. Having this limit secures from the unintentional use at account level but a Function inside an account may also overuse the concurrency and affect the execution of other Function instances. We will talk about overcoming that in the best practices section.


Function and Layer Storage

When you deploy the Function on Lambda service, it uses the storage to keep the function code with dependencies. Lambda services keep the code for every version. When you update this Function with a newer version, it keeps adding the new version code in the storage. 


AWS has kept the storage limit to 75 GB so ensure you follow the best practice of cleaning up the old version code. 75 GB seems to be a very high number but over the years, it may be exhausted with the frequent update in the code. 


Elastic Network Interface per VPC

 There are use cases where a Lambda Function needs VPC resources like RDS -mysql or so. In that case, you need to configure VPC subnet and AZs for Lambda Function. Lambda Function connects to these VPC resources through Elastic Network Interface (ENI). 


Earlier, each Function instance used to need a new ENI to connect to a VPC resource so there was a chance of hitting the threshold of 250 (default configured by AWS) very easily. But, with the latest feature of Hyperplane, it has improved the VPC networking and requires less number of ENIs for the communication between a Function and VPC resources. Mostly, this threshold is not hit in most of the use cases.

Hard Limits

Hard limits are the ones that cannot be requested to AWS for the increase. These Lambda limits apply to function configuration, deployments, and execution. We will talk about a few of the important limits in detail.

AWS Lambda Memory Limit

AWS Lambda is meant for small functions to execute for short duration so AWS Lambda memory limit has been kept max to 3GB. It starts from 128 MB and can be increased with 64 MB increments. 


This memory is mostly sufficient for event-driven business functions and serves the purpose. However, there are times when you need high CPU intensive or logical calculation based workload and may cause timeout errors due to not being able to complete the execution within time. There are few solutions available to overcome it and we will talk about those in the best practices section.

AWS Lambda Timeout Limit 

As discussed in AWS Lambda memory limit section, a Function may timeout if it doesn’t finish the execution within the time. And, that time is 15 mins (900 seconds). This is a hard limit in which Function has to complete the execution else it will throw a timeout error. 


This limit is very high for synchronous flows as by nature they are supposed to be completed within a few seconds (3-6 seconds). For asynchronous flow, you need to be careful while designing the solution and ensure each function can complete the task within this period. If it cannot, the logic can be broken into smaller Functions to complete within limits.


AWS Lambda Payload Limit

AWS has kept the payload max limit to 6 MB for synchronous flow. It means, you cannot pass more than 6 MB of data as events. So, while designing the Lambda Function, you need to ensure that consumer and downstream systems are not sending very heavy payload requests and responses respectively. If it is, then Lambda is not the correct solution for that use case.


AWS Lambda Deployment Package

AWS Lambda size limit is 50 MB when you upload the code directly to Lambda service. However, if your code deployment package size is more, you have an option to upload it on S3 and download it while triggering the Function invocation. 


Another option is that you use the Lambda layers. If you use layers, then you can have max 250MB size for your package. You can add up to 5 layers for a Function. However, If you are uploading such a huge code, then there is a real problem in your design you should look into. A Function is meant for small logical code. This huge code may cause high cold start time and a latency problem.


Lambda Design Best Practices around Lambda Limits

As we have talked about most of the common Lambda limits, let’s now discuss the workarounds, tips and best practices to design Lambda Function around these limits.

  • Even though AWS has put the concurrent execution limit to 1000 but that is at account level. You must define the concurrency limit at Function level as well so that one Function overuse doesn’t affect the running of other Functions in the account (Bulkhead pattern).


  • Lambda version is a very important feature but continuous update of the Function increases the storage requirement and may hit the threshold limit (75 GB) and that you will come to know suddenly while doing the production deployment. So plan ahead with an automation script that should clean up the old versions of Function. You may decide a number (may be 5-10) of versions to support.


  • For a synchronous flow, keep the timeout limit very low (3-6 seconds) for functions. It ensures that resources are not clogged for a long time unnecessary and saves cost. For asynchronous flow, based on the monitoring metrics decide the average time of execution and configure the timeout with some additional buffer. While deciding timeout configuration, always keep in mind the downstream system’s capacity and SLA for the response.


  • For a CPU intensive logic, allocate more memory to reduce the execution time. However, just keep in mind that having more than 1.8 GB memory along with a single threaded application won’t give better performance beyond a limit. You need to design the logic to use a multi-threaded strategy to use the second core of the CPU.


  • For Batch processes that need more than 15 minutes of time to execute, break the logic in multiple Functions and use the Lambda Destination or  Step Functions to stitch together the events.


  •  Lambda Function has a temporary instance storage /tmp with 512 MB capacity. This will go off once execution is completed and instance is automatically stopped after a certain time period. Don’t use this capacity as Function should be designed for stateless flow.


Summary

AWS Lambda limitations are in quite high numbers but most are consciously thought through and applied. These limits are not to restrict you to use Lambda service but to protect you from the unintentional usage and DDoS type of attacks. You just need to make yourself aware of these limits and follow the best practices discussed here to get the best out of Lambda Functions.


Rajesh Bhojwani September 04, 2020
Read more ...

AWS Lambda Security

The security of an application is one of the most important non-functional requirements. Every application and underneath infrastructure has to go through strict security guidelines to secure the whole system. Serverless architecture is getting more attention from the developer community, so do hackers as well and AWS Lambda is a widely used service that hosts serverless architecture applications. 


There are several myths around Lambda and serverless architecture and the most common one is that whole security for these apps relies on AWS. But that is not correct. AWS follows the shared responsibility model where AWS manages the infrastructure, foundation services, and the operating system. And the customer is responsible for the security of the code, data being used by Lambda, IAM policies to access the Lambda service.


By developing applications using a serverless architecture, you relieve yourself of the daunting task of constantly applying security patches for the underlying OS and application servers. And concentrate more on the data protection for the application.


In this article, we are going to discuss many different aspects of the security of the Lambda function.

Data Protection in AWS Lambda

As part of data protection in AWS Lambda, we first need to protect account credentials and set up the individual user accounts with IAM policies enabled. We need to ensure that each user is given the least privileges to fulfill their jobs.


Following are different ways, we can secure the data in Lambda:


  • Use multi-factor authentication (MFA) for authentication to each user account.


  • Use SSL/TLS to have communication between Lambda and other AWS resources.


  • Set up CloudTrail service with API and user activity logging.


  • Use the AWS server-side and in-transit encryption solutions, along with all default security controls within AWS services.


  • Never put sensitive identifying information such as account numbers, credentials of the services in the code.


Encryption in Transit

Lambda API endpoints are accessed through secure connections over HTTPS. When we manage Lambda resources with the AWS Management Console, AWS SDK, or the Lambda API, all communication is encrypted with Transport Layer Security (TLS).


When a Lambda function connects to a file system, It uses encryption in transit for all connections.

Encryption at rest

Lambda uses environment variables to store secrets. These environment variables are encrypted at rest.

There are two features available in Lambda while encrypting the environment variables:


AWS KMS keys -

For each Lambda function, we can define a KMS key to encrypt the environment variable. These keys can be either AWS managed CMKs or customer-managed CMKs.


Encryption helpers -

By enabling this feature, environment variables are encrypted at the client-side even before sending it to Lambda. This ensures secrets are not displayed unencrypted on AWS Lambda console or in CLI or through API.


Lambda always encrypts files that are uploaded to Lambda, including deployment packages and layer archives.

Amazon CloudWatch Logs and AWS X-Ray used for logging, tracing, and monitoring logs also encrypt data by default and can be configured to use a CMK.


IAM Management for AWS Lambda

IAM management in AWS typically handles users, groups, roles, and policies. For a new account by default, IAM users and roles don't have permission for Lambda resources. An IAM administrator must first create IAM policies that grant users and roles permission to perform specific API operations on the Lambda and other AWS services. The administrator must then attach those policies to the IAM users or groups that require those permissions. 


There are a few best practices to handle the IAM policies:

  • AWS has already created many managed policies for the Lambda function. So to start quickly attach these policies to the users.

  • Start with the least privileges rather than being too lenient initially and trying to tighten them later.

  • For sensitive operations, enable multi-factor authentication (MFA). 

  • Use Policy conditions to enhance security. For example - allow a request to come only from a range of IP addresses or allow a request to come only within a specified date or time range.


Auto-Generate Least-Privileged IAM Roles

An open-source tool for AWS Lambda security is available that automatically generates AWS IAM roles with the least privileges required by your functions. The tool:


  • Saves time by automatically creating IAM roles for the function

  • Reduces the attack surface of Lambda functions

  • Helps create least-privileged roles with the minimum required permissions

  • Supports Node.js and Python runtimes for now.

  • Supports Lambda, Kinesis, KMS, S3, SES, SNS, DynamoDB, and Step Functions services for now.

  • Works with the serverless framework


Logging and Monitoring for AWS Lambda

In AWS, we have two logging tools relevant to watch for security incidents in AWS Lambda: Amazon CloudWatch and AWS CloudTrail.


For Lambda security, CloudWatch should be used to: 

  • Monitor “concurrent executions” metrics for a function. Investigate the spikes in AWS Lambda concurrent executions on a regular basis.

  • Monitor Lambda throttling metrics 

  • Monitor AWS Lambda error metrics. If you observe a spike in timeouts, it may indicate a DDoS attack 

When we enable data event logging, CloudTrail logs function invocations and we can view the identities invoking the functions and their frequency. Each invocation of the function is logged in CloudTrail with a timestamp. This helps to verify the source caller.


One of the most significant benefits of enabling CloudWatch and CloudTrail for your AWS Lambda serverless functions comes from the built-in automation. Notifications, messages, and alerts can be set up that are triggered by events in your AWS ecosystem. These alerts enable you to react to potential security risks as soon as they are introduced. 

Securing APIs with API Gateway

AWS API Gateway along with AWS Lambda enables us to build secure APIs with a serverless architecture. With this, we can run a fully managed REST API that integrates with AWS Lambda functions to execute business logic.


Following are controls that can be used to control access to APIs:


  • Generate API keys and use it with usage plans with usage quota limiting

  • Use AWS IAM roles and policies to grant access to user

  • Use Cognito user pools to enable authentication. It has features to authenticate using third party providers like Facebook, Twitter, GitHub, etc..

  • Use Lambda authorizer functions for controlling access at API methods levels. It can be done using token authentication as well as header data, query string parameters, URL paths, or stage variables.


Summary

Serverless architecture takes away a lot of pain in operation management. This also offloads the onus of patching OS and other infrastructure levels of security concerns. However, it opens new vectors for attacking like events injection and many others which are not known yet. But security basics remain the same and application and data-level security have to be enabled and monitored regularly to avoid any security attacks. 


Rajesh Bhojwani July 31, 2020
Read more ...


An in-depth overview of the major topics around debugging serverless

Serverless computing has changed the way enterprises design and build their production applications. It is no longer a hype but a mainstream application development technology. It has become a game-changer, enabling developers to build and ship faster. Now, a developer can concentrate on writing business logic rather than worrying about server provisioning, maintenance, idle capacity management, auto-scaling, and more. 

AWS Lambda function is now a well-known service that builds serverless applications. Since its inception in 2014, it has been adopted very well by developers and architects.

AWS serverless application comprises several components. However, Function is the backbone of it. Other AWS services interact with each other through Function, completing the serverless workflow.

In this article, we are going to do a deep-dive and understand the testing and debugging of a typical Lambda serverless application. Before going further, let us first understand all the components involved in building a serverless application.

1. Event Source: - Lambda Function doesn’t have a REST API endpoint. Hence, it cannot be called directly from outside clients. It needs event triggering to get invoked. An event can be:
    Data record change of a DynamoDB table
    Request to a REST endpoint through API Gateway
    Change in the state of resource e.g. file uploaded to the S3 Bucket

It can also be triggered through CloudWatch Events. As Lambda has been evolving, it’s constantly adding many other types of events. 

2. Function: - All the functional logic goes here. It does support many languages, including but not limited to Java, Go, Node, Python. The event source triggers it and then connects to all other AWS Services to create a serverless pattern.

3.Services: - It can be either an AWS service or an external service. These services would be required either to persist or retrieve the data from other systems. Some of the services like SQS, SNS complements serverless flow with event-driven architecture.

So, we need to keep these components in mind while understanding the debugging of an AWS serverless application.

Debugging monolithic apps vs serverless

With all of the talk these days about microservices and serverless applications, monolithic applications have become the scourge of cloud systems design. However, it is known that there are certain aspects of application design where monolith still does better than microservices and serverless. And, debugging is one of them. Microservice and serverless didn’t come to address any of the existing debugging challenges of a monolith application. In contrast, it has brought new challenges though.

Different Aspects of Debugging a Monolith

1. Debugging a monolith application conjures specific images in the developer’s mind. The most common image would be the local environment using the favorite IDE ( Eclipse, VSC, IntelliJ, etc..). It is as simple as creating a breakpoint at the line of code that needs to be inspected and run the application in debug mode.


2. In a monolith, most of the issues are debugged in local as it uses to have only a few failures points UI/Backend or the Database behavior and in most cases, these can be set up in the local environment. 

3. In a monolith, eclipse/IntelliJ is used to do remote debugging as well. It could be done from Eclipse, VSC, or STS IDE. It would certainly need privileged access to connect to the remote servers. It is being used in exceptional cases where simulating the same scenario was not at all possible in local.

4. Debugging a monolith application is simple and easy since all tasks run on a single process, it makes things much easier to test.

5. Though debugging a monolith is easier but it takes a lot of effort. A large application may take minutes instead of seconds to startup which slows down debugging effort. Also, reaching to a debugging breakpoint takes time if the monolith app flow is huge.

This was all about monolith debugging. Serverless has changed the way we do design and build the applications and that changes the debugging as well.

Different Aspects of Debugging a Serverless

1. With serverless applications, logging has become the most common way of debugging issues. Disk space has become cheaper and logs can be rolled after 30 days or so. It has become important to log everything that the service does and that helps developers understand the real behavior.

2. Serverless flow generally has more components involved, hence, failure points have increased. All these components may not be able to set up in the local environment. 

3. Serverless applications by nature don’t give an option for remote debugging.

4. Serverless needs hopping across process, machine, and networking boundaries and that introduce many hundreds of new variables and opportunities for things to go wrong – many of which are out of the developer’s control but he has to debug when things go wrong.

5. Serverless brings loose dependency between components and as such it is harder to determine when compatibility or interface contracts are broken. It won’t know something has gone wrong until well into the runtime.

So, we can see that there are many differences in the way debugging works in monolith and serverless. Let’s talk a little more about the challenges serverless brings in debugging applications.

 The Challenges of Debugging a Serverless

A serverless application in AWS has event sources like API Gateway, DynamoDB, SQS, Kinesis invoking a Lambda Function. Then, the function makes calls to DBs, SNS/SQS, the workload on ECS/EKS, or even services running outside AWS.

So, it is comprised of so many components and any issue may require to debug these so many components. Here are a few common challenges:

1. Distributed Components - serverless application components are highly distributed. It can be within AWS or outside. Simulating these local may not be always possible and doing debugging on a live environment is neither cheap nor easy.

2. Lack of remote debugging - serverless application by nature doesn’t give access to server and OS level so remote debugging is not an option. For rare cases, where the developer is not able to understand why the issue is happening and cannot do live debugging makes him handicapped.

3. Ephemeral - servers are ephemeral by design in serverless computing and that gives very limited opportunity to the developer to debug the issue.

4. High Cost - as most of the debugging are done in a live environment, it adds to the monthly bill. An application running on a live environment and being debugged for bugs/defects really hit the ROI to the business.

5. Lack of frameworks for local setup - there are very few frameworks available to do setup Lambda in locally and those also come with limitations. 

Debugging Serverless Offline

Running and Debugging an application in local is a critical part of software development. Understanding that, AWS and even open source community came up with several tools that enable Lambda Function and serverless workflow to run and debug in local.

AWS Serverless Application Model (SAM) 

It is an open-source framework majorly contributed by AWS that we can use to build serverless applications on AWS. SAM has two major components:

SAM template specification - We use this specification to define serverless application. We can describe the functions, APIs, permissions, configurations, and events in the specification.

SAM templates are an extension of AWS CloudFormation templates, with some additional components that make them easier to work with. Below is the YAML template for SAM specification:


SAM command-line interface (SAM CLI) - We use this tool to build serverless applications defined by AWS SAM templates. The CLI provides commands that enable us to verify that AWS SAM template files are written according to the specification, invoke Lambda functions locally, step-through debugging Lambda functions, package and deploy serverless applications to the AWS Cloud.
The process to Set Up the Debugger Run the below commands to start and debug Lambda in local:
sam init – It generates a preconfigured AWS SAM template and example application code in the language that we choose.

sam local invoke and sam local start-API – We use this command to test your application code locally. By adding a parameter -d we can enable a debug port as well.

e.g. sam local invoke -d 9999 -e event.json HelloWorldFunction

Once the function is up and running, the debugger is listening to localhost:9999. The event.json file has the event details configuration that is used to trigger the Lambda Function. Now, VSC or any other IDE can be used to debug the code. Let us take a walkthrough with VSC here. 

When we hit the F5 button, VSC opens up the launch configuration. This configuration needs to be updated so that it enables the debugger UI to debug at a breakpoint. Below is a sample for the .vscode/launch.json configuration:
 
Once we run the debugger UI with the above launch.json, VSCode will attach itself with SAM CLI process and we should be seeing the breakpoint code is highlighted. We can also use the inspect option to see the detailed values of an object being debugged.

Alternatively, we can install AWS Toolkit in VSCode. This tool enables the links for running the function in locally. It also enables the debug option. To supply the event information, the Configure indicator from the CodeLens line is used. See the below example:

Serverless Framework - 

It is also an open-source framework to provide a powerful, unified experience to develop, deploy, test, secure, and monitor your serverless applications. The benefit of this framework from AWS SAM is that it is not tightly coupled with AWS and can be used for other cloud functions like Azure Function.
The serverless framework comes with an open-source CLI which provides the support with commands to create and build serverless application using template yml file.

The process to Set Up the Debugger

Install the Serverless CLI using below command:
npm install -g serverless
Create a new Serverless Service/Project:
serverless create --template aws-nodejs --path my-service
It will generate the scaffold for a nodejs function code having a handler.js file along with a serverless.yml file.
handler.js file has the handler method which will be invoked through events. Business logic will reside in this file. 
serverless.yml file has a configuration for all the Functions, Events, and resources required for a serverless application flow.
Now, as our application is ready to run, we need to install a plugin called Serverless Offline. This plugin emulates AWS Lambda and API Gateway on your local machine to speed up your development cycles. 
Add serverless-offline in your project using below command:
npm install serverless-offline --save-dev
Then, inside your project’s serverless.yml file add plugin entry. If there is no existing plugin in the yml file, then add a new entry:
plugins:
  - serverless-offline
To test if the plugin got installed successfully run this command:
serverless offline
It should print all the options for the plugin to run:


Now, run a nodejs application in debug mode.

Update the script section of the package.json file residing in the root folder:


"scripts": {
"start": "./node_modules/.bin/serverless offline -s dev",
"debug": "export SLS_DEBUG=* && node --debug ./node_modules/.bin/serverless offline -s dev",
"test": "mocha"
}

Note: This script is for the Linux environment. For Windows, we need to replace the “debug” parameter with:

 "debug": "SET SLS_DEBUG=* && node --debug %USERPROFILE%\\AppData\\Roaming\\npm\\node_modules\\serverless\\bin\\serverless offline -s dev"

In the above code, we need to pay attention to the only debug section. The SLS_DEBUG environment variable is set to let the serverless framework know that this application needs to be running in debug mode. And once node executes node --debug command, it will use the serverless offline plugin to run the function in locally. We can also define the port in serverless.yml file which we want to map with this nodejs code.

Now, we can tell VSCode to run this code and attach a debugger to it by pressing F5. It will prompt you to set up a launch configuration. We need to use :

.vscode/launch.json needs to have below configuration:

Now we simply hit F5 or click debug > chose Debug and click play, our lambda functions will run locally with a debugger attached. This is what it would look like:

How to Debug Serverless

So far, we have seen how to debug a serverless application locally before we deploy the application in the AWS environment. However, once the application runs in a live environment, new issues may be discovered as it will now connect to real AWS services. It will talk to some of the services which we would not even test locally. Now, we will see the steps on how to debug application while running on AWS live environment.

Debugging with API Testing Tools -

To debug a serverless application on AWS, we may have to start with API Gateway testing. There are various clients available that can be used to test an end-point. The most common tools are Postman and SoapUI. Curl can also be used for simple testing. 

Postman provides options for setting the request type, headers, SSL certificates, body, and tests. This approach works great for functions tied to API endpoints as event triggers, such as API Gateway. But not all Lambda functions are used this way. If a function is triggered asynchronously by other services, such as SQS, Kinesis, or even CloudWatch, we need to have other tools to debug.

Debugging with AWS Console -

AWS Console provides a testing option for the Lambda function directly without the involvement of the event source. It is very useful while deploying the lambda first time on AWS and check real-time issues.

It requires Test events to be created and run those events directly on the function while you are writing and building your application. These test events can emulate what is expected from any AWS services like SQS, Kinesis, SNS or so. Below is an example used to create a thumbnail from an image whenever it gets uploaded in the S3 bucket:
When we hit the Test button, output will be generated as below:
We can further check metrics using the “Monitoring” tab. It has out of the box metrics to check error rate, throttling, and others to help to debug the issues. Detail logs can also be viewed using the “View logs in CloudWatch” button.

Debug using AWS CloudWatch Logs -

CloudWatch Logs is the main source of information on how an AWS application is behaving. The same applies to the Lambda function. Lambda Function by default sends the log data to CloudWatch. CloudWatch creates a LogGroup for each Lambda function. Inside a LogGroup, there will be multiple Log Streams collating the logs that get generated from a particular Lambda instance (Lambda concurrency allows multiple instances created for a Lambda function).


Log Streams will have log events, clicking on each event will provide detailed information for a particular Lambda function invocation.


So, whenever a Lambda function has an issue, we know the steps on how to dig through and see the logs that are happening for that particular invocation. Logs appear in CloudWatch Logs are almost real-time so put logs as much as you need to debug an issue. 
However, there are few caveats using CloudWatch logs:
  • AWS does charge based on the size of the log data being stored in it. So, it is recommended to remove unnecessary log statements once the bug is fixed. It may also increase the size of your Lambda function as well which may cause a delay in loading and starting a function (warm start time).

  • Some of the enterprises which work with multiple clouds and/or on-premise platforms would be using Splunk or ELK for log aggregation and CloudWatch being very tightly coupled with AWS services only, would not be preferred by those organizations. In that case, CloudWatch Logs are streamed to these commercial tools through streaming services like Kinesis. These tools are also good at providing a visualization layer by creating several dashboards as per need. 

  • CloudWatch Logs becomes costly over time as AWS charge more for higher storage requirement. ELK being open-source is preferred by many to save the cost.
Below is a typical flow used to store and view the logs by these enterprises:


Debugging using X-Ray -

Despite having rich features in CloudWatch Logs, it is limited to providing information only for one component and in this case, it would be a Lambda Function. But, for a typical serverless flow, a function would be calling other AWS services like dynamodb, S3, or other services. What if we need to get more details around these integrations - how they are performing, what failures are causing performance issues. 

For these, AWS introduced X-Ray which helps developers analyze and debug distributed applications. X-Ray provides an end-to-end view of requests as they travel through the application, and shows a map of the application’s underlying components. An X-Ray can be used to analyze both applications in development and in production, from simple three-tier applications to complex microservices applications consisting of thousands of services.


So, if we need to debug an application on the AWS environment, we may end up using multiple tools to get all the information. And, that’s why there are many commercial tools evolving and providing a seamless experience to monitor, trace, and debug the distributed applications with end to end flow visualization.

Summary

Serverless has been a big hit in revolutionizing the way we build and deploy cloud applications. While, it solves a lot of problems for developers managing infrastructure but introduces a few like monitoring, debugging, testing, and tracing. That’s the reason the focus is now more around building the tools addressing these problems. Cloud providers and commercial vendors are coming up with tools that can help monitor, debug end-to-end. Currently, they are evolving addressing one issue at a time. Over the period, these tools will mature and make debugging easier.

Rajesh Bhojwani June 29, 2020
Read more ...